In January 1934, the dollar was devalued against gold by 69% when the US federal government arbitrarily changed the definition of the dollar. What had been 23.22 grains of fine gold ($20.67 per ounce; $0.66 per goldgram) was suddenly cheapened with the stroke of President Franklin Roosevelt’s pen to 13.71 grains of gold ($35 per ounce; $1.13 per goldgram).
In what has been a long downhill ride, today a dollar exchanges for only 0.18 grains of gold and $2725 per ounce ($87.61 per goldgram). I expect that downtrend to continue as the dollar loses purchasing power from perennial inflation.
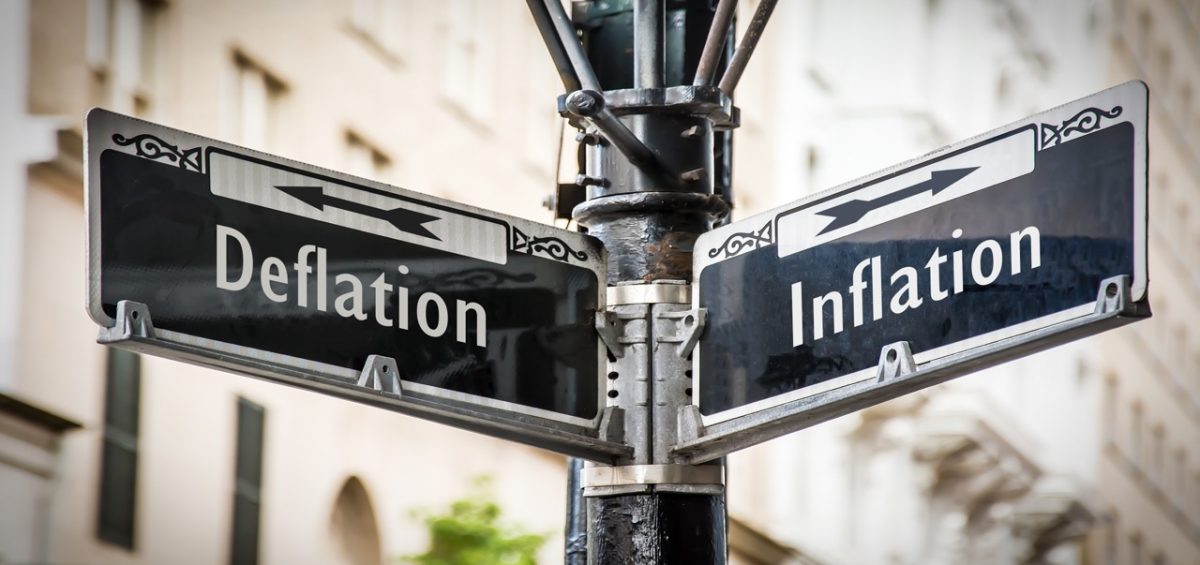
Others, however, expect deflation as occurred in the 1930s, when the dollar gained purchasing power. They argue that global debt continues to build to the point that it has become unsustainable because not enough wealth (purchasing power) is being created to service the debts.
While arguments can be made for both schools of thought, the overriding fact is that the future cannot be predicted. Nevertheless, the value of gold in a fiat currency world can be objectively measured with my Fear Index, a useful tool I developed forty years ago that has proven reliable. It can be applied to any fiat currency or all of them in the aggregate, but here I apply it just to the US dollar.
The formula for the Fear Index and its value as of December 31, 2024, are as follows:

Over the years I have explained the Fear Index several ways. It is a measure of gold’s relative value to the dollar, a trend indicator, and a useful trading model with buy and sell signals (we are still on the December 2022 buy signal when gold was $1822). I have also explained the Fear Index in relation to the dollar’s monetary balance sheet, namely, that dollars are backed by the assets on bank balance sheets, including the US reserves of gold, from which the dollar is derived. But there is still another way to view the Fear Index, whose fundamental nature can be compared to the ever changing multiple (the price/earnings ratio) at which the stock market trades.
Today this multiple of the S&P 500 is just under 30, down from the highs above 40 near the top of the internet bubble and also the pandemic. In the 1970’s and before that in the late 1940’s, the multiple hovered as low as 6. Why the big swing in the multiple?
Countless factors come into play when assessing the changes in the multiple, and I have yet to see any mathematical model that successfully predicts how and when these changes in the multiple will occur. The reason of course is that the multiple is dependent upon people’s demand for stocks, and we know that people’s preferences change. Further, it is impossible to predict these changes in preference. Nevertheless, the multiple can still be very useful.
We know from experience that the multiple is low when is it near 6, and high when it is 30. We also know that the multiple does not change overnight. It changes slowly, and its trend can be discerned. For example, it trended up from 6 in 1949 until it approached 22 in 1961. It then again hit 6 in 1974 and 1980. Thereafter, it sailed over 40 at the peak of the Internet bubble. Since then, it has been generally moving sideways in the 20s and 30s.
These changes in the multiple are powerful forces that are important in determining the market’s valuation as well as the value and price of the shares of any company. For example, if a stock trades at $20 with a 20 multiple, and then the company’s earnings climb from $1.00 to $1.50, its price nevertheless drops to $15 if its multiple over that time drops to 10, highlighting he importance of the multiple.
Therefore, assuming you like the outlook for a company and expect rising earnings, buy when its share’s multiple is low and hold it while the multiple is rising. Conversely, sell when the company’s profit outlook is diminishing at a high multiple, and avoid the share until it reaches a low multiple and the outlook changes for the better. Clearly, investing in shares is more complex, so view this valuation method as just one tool that can be used when deciding to buy or sell the shares of a company.
Now view the Fear Index in the same way that I just explained the multiple. It too is determined by a multitude of factors that cannot be predicted. Nevertheless, we can calculate the Fear Index to know whether it is low or high compared to historical results and rising or falling, as illustrated by the following monthly chart.
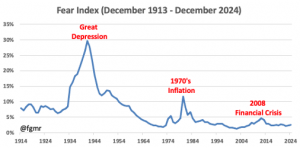
As we can see from the above chart, the Fear Index at 3.19% is low when compared to its historical values since 1913. But also illustrated is an important point that relates directly to this index’s name. When fear about the safety of one’s fiat currency is being questioned, the Fear Index rises. When that fear dissipates and confidence in the monetary system returns, the Fear Index falls.
To further explain this point, a monetary system comprises an amount of ‘purchasing power’, which is an abstract concept that unfortunately is too often ignored from analyses of money and currency. This purchasing power – which gives one who holds it the power to buy, save, or invest – is conveyed from payer to payee in two different ways, through gold (a tangible asset) or fiat currency (a promise of some bank). When these promises are broken or even just doubted, people move their purchasing power to safety. Gold’s 5000-year record establishes that it is the safest asset of all.
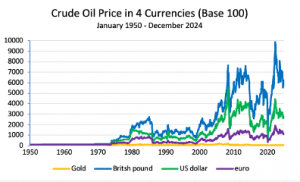
Note how gold has preserved purchasing power in following chart of crude oil prices. An ounce or gram of gold buys essentially the same amount of crude oil (energy) today as it did 74 years ago.
Returning to the Fear Index chart, the index peaked near 30% in the Great Depression and then declined with the restoration of confidence in the dollar. It rose in the inflationary 1970s and then again during the 2008 Financial Crisis. Note that a new uptrend – though nascent – began in December 2022.
It therefore seems reasonable to ponder whether history is in the process of repeating, and if so, we can also question whether this new uptrend will be long-lasting, regardless of its cause. It does not matter whether the monetary problem driving gold higher is the current inflation, potential deflation, or another banking crisis. The point is that gold wins when the Fear Index is climbing, which is what it has been doing for two years now.
Gold wins because people move their purchasing power out of dollars into gold, just like they did in the 1930s, 1970s, and earlier this century. What matters is not the label (the dollar price) attached to gold. The important measure is the percent of purchasing power (i.e., M2, the total quantity of dollars) that is conveyed by the weight of gold reported to be held in the US gold reserve that presently backs 3.19% of every dollar.
Given that dollars derive from gold, which along with silver is the money of the American Constitution, it is logical that the Fear Index is the key determining factor of gold’s value. To put numbers on it to prove this point, let’s assume the Fear Index doubles to 6.38% in two years. Then regardless of whether the Federal Reserve increases (inflation) or decreases (deflation) the quantity of dollars, the purchasing power of gold measured in dollars will double, which I believe to be a reasonable projection.
Using the Fear Index to project the gold price in both scenarios and solving for “X”, the projected gold price is:
Inflation: assume M2 rises 4% p.a.; gold reserves are unchanged; Fear Index equals 6.38%

Deflation: assume M2 declines -4% p.a.; gold reserves are unchanged; Fear Index equals 6.38%

In both scenarios, the projected gold price rises, but the Fear Index is key. If it doubles, the purchasing power of gold doubles, regardless of whether the dollar inflates or deflates in the future, making the dollar price of gold in a fiat currency world to be of secondary importance to the Fear Index.



 My objective is to share with you my views on gold, which in recent decades has become one of the world’s most misunderstood asset classes. This low level of knowledge about gold creates a wonderful opportunity and competitive edge to everyone who truly understands gold and money.