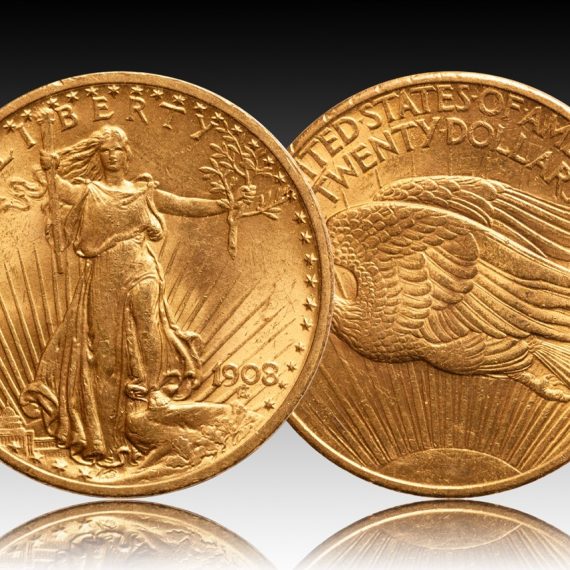
January 5, 2004 – Seventy years ago this month the dollar was devalued against gold by 69% when the federal government arbitrarily changed the definition of the dollar. What had been 23.22 grains of gold ($20.67 per ounce; $0.66 per goldgram), with the stroke of Franklin Roosevelt’s pen was suddenly cheapened to 13.71 grains of gold ($35 per ounce; $1.13 per goldgram).
Today a dollar exchanges for only 1.15 grains of gold. So it has been a long downhill ride for the dollar.
Even though it is the dollar that has lost so much purchasing power, it is gold that ironically is thrashed as the barbarous relic. But as Shakespeare wrote: There is a tide in the affairs of men, and more to the point, Which, taken at the flood, leads on to fortune. The tide is changing in favor of gold. The Fear Index and the accompanying chart explain why.
The formula for the Fear Index and its value as of December 31st are as follows:
| (US Gold Reserve) * (Gold’s Market Price) | |
| ———————————————————————- | = Fear Index |
| M3 | |
| (261.5 million ounces) * ($417.25 per ounce) | |
| ———————————————————————- | = 1.24% |
| $8,835 billion | |
Over the years I have explained the Fear Index several ways. It is a measure of gold’s relative value to the dollar, a trend indicator, and a useful trading model with buy and sell signals (we are still on the May 2002 buy signal that said to hold gold in preference to the dollar). I have also explained the Fear Index in relation to the dollar’s monetary balance sheet. But there is still another way to explain the Fear Index – its fundamental nature is very much like the ever changing multiple (the price/earnings ratio) at which the stock market trades.
Today the multiple on the S&P 500 is about 30, down from the highs above 40 near the top of the stock market bubble. But in the late 1970’s and before that in the late 1940’s, the multiple was about 5. Why the big swing in the multiple?
Countless factors come into play when assessing the changes in the multiple, but I have yet to see any mathematical model that successfully predicts how and when these changes in the multiple will occur. The reason of course is that in the final analysis, the multiple is dependent upon people’s demand for stocks, and we know that people’s preferences change. And it is impossible to predict these changes in preference. Nevertheless, the multiple can still be very useful.
We know from past experience that the multiple is low when is it near 5, and high when it is over 30. We also know that the multiple does not change overnight. It changes slowly, and its trend can be discerned. For example, it trended up from around 5 in the late 1940’s until it approached 22 in 1959. It then trended down until the late 1970’s. Thereafter, it generally trended up to the 2000 peak of the stock market bubble. Since then it has been trending down.
These changes in the multiple are powerful forces that are important in determining the market’s valuation. In other words, if a stock trades at $20 with a 20 multiple, and then its earnings climb from $1.00 to $1.50, its price nevertheless drops to $15 if its multiple over that time drops to 10. So the importance of the multiple is clear.

Now view the Fear Index in the same way that I just explained the multiple. As we can see from the above chart, the Fear Index is very low when compared to its historical values since 1913. Also, note the past trends in the Fear Index.
The Fear Index peaked near 30% by the end of the Great Depression and has been declining ever since (dotted line). But this long-term downtrend can be divided more precisely into three distinct trends.
The first trend shows the decline in the Fear Index to the 1970’s. The second is an uptrend throughout the 1970’s (marked by the uptrend channel on the above chart), followed by the downtrend in the Fear Index since 1980. Note, however, that a new trend is now beginning.
This fourth trend has begun by breaking above the previous downtrend line. And here’s the important point of this analysis.
We can see from the above chart that these trends are long lasting. In fact, the last time the Fear Index broke into a new uptrend was in the 1970’s, and we all know what happened to gold and the dollar in that decade. What’s more, the same thing can be expected to happen to gold and the dollar over the next several years now that this new uptrend in the Fear Index has begun. History is in the process of repeating.
Using normal technical analysis, it is logical to assume that the Fear Index will trend upwards until it reaches the major long-term downtrend (the dotted line). Let’s further assume that the Fear Index reaches that downtrend at the 4.5% level. We can now use these assumptions to project the price of gold, but first, we have to restate the Fear Index formula. We know the future value of the Fear Index (4.5%), so instead of solving the formula to calculate the Fear Index, we instead are solving the formula to calculate the gold price. To do this, we have to use some basic algebra to change the formula to the following:
| Fear Index * M3 | ||
| Gold’s Market Price = | ———————————————————————- | |
| (US Gold Reserve) |
Let’s assume that the US Gold Reserve remains unchanged at 261.5 million ounces, and further, that M3 climbs 10% from $8,835 billion to $9,718.5 billion. Solving for the gold price, under these assumptions, we get $1,672 per ounce ($53.77/gg).
Now, let’s say that you are a deflationist, and therefore, instead of M3 growing by 10%, you expect it to decline by 10% to $7,951.5 billion. Using the above formula to solve for the gold price, and again assuming a 4.5% Fear Index and the gold reserve remains the same, we get $1,368 per ounce ($43.99/gg).
So regardless whether there is inflation or deflation in our future, the point is that gold wins. It always wins when the Fear Index is climbing – which is what it has been doing for nearly two years now – because when the Fear Index is climbing, gold’s purchasing power is increasing relative to that of the dollar.
Notice that I left ‘time’ out of the equation. Do those changes in M3 happen in one year, two years or some other time period? Similarly, by when will the Fear Index rise to 4.5%?
Last year (when the Fear Index was 1.02%) I projected that by February 2004 M3 would grow by 7.5% p.a. to $9,391 billion, the Fear Index would replicate its 1971 trajectory to reach 2.53% by that month, and that the gold reserve would remain unchanged. These assumptions resulted in a $908 ($29.19/gg) gold price by next month. While clearly my timing was too optimistic and my M3 growth was too high, I did get the direction of the Fear Index (and therefore also the direction of the gold price) right, which I think is the important point to looking ahead for 2004. The Fear Index will continue to climb from here, and so will gold.
In fact, as the page 1 chart shows, the uptrend in the Fear Index is just beginning, now that the break of the previous downtrend line has been confirmed. So I continue to expect that at some point during 2004, the Fear Index will touch 2.53%, and M3 will be $9,391 billion, with the result that gold will be $908 ($29.19/gg). It obviously won’t be by February as I projected last year at this time, but these events and this gold price will occur I expect before December 2004. So my year-old projection in the end will I expect not be too many months off the mark.
Lastly, if you think my 2.53% projection for the Fear Index is too high, I have three comments. First, the page 1 chart shows some rapid increases in the Fear Index in the 1970’s. For example, in the six months from November 1972 to May 1973, the Fear Index nearly doubled. I’m expecting history to repeat.
Second, the page 2 chart of the gold price presents another picture that I think is useful. Note the similarity between A-B from the early 1970’s to the present day C-D. Again, if history repeats – and I think there are enough reasons that it will, as I have been discussing in these letters the past few years – then the gold price is about to start accelerating sharply higher and away from the C-D uptrend line, just like it did to A-B in the early 1970’s. And given the negative sentiment about gold prevailing today – which again is another similarity to the early 1970’s – it is not unreasonable to look for $908 ($29.19/gg) in relatively short order. My guess is that it will happen by this June.
My third comment is that seven decades of trashing gold will soon end. Referring again to the page 1 chart, when the Fear Index breaks above the 70-year downtrend (the dotted line), gold will be entering not only a new bull market, but also a new era.

 My objective is to share with you my views on gold, which in recent decades has become one of the world’s most misunderstood asset classes. This low level of knowledge about gold creates a wonderful opportunity and competitive edge to everyone who truly understands gold and money.
