July 27, 2009 – Silver has also bounced over the past couple of weeks since the last letter. In fact, silver has outperformed, rising 8.5% during this period compared to gold’s 3.3% climb. Turning to the page-3 silver chart, there are a couple of important observations. As noted in the last letter, silver did slightlyRead more
Blog
July 27, 2009 – In my previous commentary, I advised that “the worst is over and further, it looks like both precious metals will bounce from here.” We did indeed get that bounce, but it was from an extremely oversold condition. Consequently, we need to give the market more time to prove itself. Even thoughRead more
July 27, 2009 – I have updated the same chart of the Dow Jones Industrials Average presented in recent letters, but also made an important change by re-drawing the red line that had been marking overhead resistance. Please take a close look at the following chart. It is clear that the red line has becomeRead more
July 25, 2009 – The XAU Index is again testing overhead resistance at the 152-154 area, which has been discussed many times recently. Like gold, the XAU Index may also do some ‘backing & filling’ over the next few weeks. But the trend remains up.
July 13, 2009 – The chart below presenting total US employment over the past twenty years was prepared by the Economic Policy Institute. The EPI is a Washington-based think tank that focuses upon the interests of low- and middle-income workers, with particular reference to their economic condition. This chart and an accompanying article about theRead more
Silver (and gold) have been pushed into an extremely oversold condition. Silver, for example, has dropped on 7 of the last 9 trading days, declining 10.5% during this period. That is extreme selling pressure.
Gold has been pushed into an extremely oversold condition. Fortunately though, and quite remarkably given this relentless selling pressure, little damage has been done to its chart. So while gold dipped back deeper than I expected, I think the worst is over and further, it looks like both precious metals (gold and silver) will bounceRead more
July 13, 2009 – The countertrend rally in the price of long-term government paper is probably over. The reality of too much federal government debt that needs to be borrowed is about to overwhelm the debt markets and send yields higher. The 30-year T-bond is already showing signs of weakness. It is only a matterRead more
Beginning in April, the dollar fell pretty much in a straight line into early June. Since then the US Dollar Index has moved sideways on either side of 80, and it has clearly demonstrated an inability to rally, which is a sure sign of underlying weakness. It is also a good indication that the next major move for the dollar in all likelihood will be down.
I noted in the last commentary, the importance of resistance for the gold/silver ratio at 69. I even drew a red horizontal line at that level, which can be seen again on the accompanying chart. I also warned: “We simply have to stay alert for the possibility of a deeper correction.”


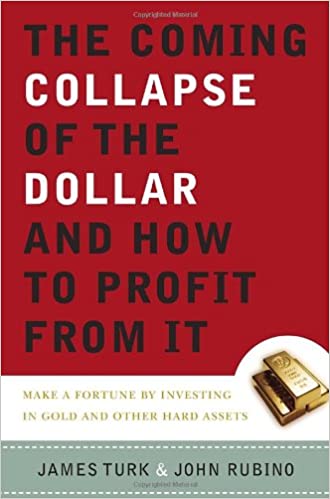
 My objective is to share with you my views on gold, which in recent decades has become one of the world’s most misunderstood asset classes. This low level of knowledge about gold creates a wonderful opportunity and competitive edge to everyone who truly understands gold and money.